Showing posts with label nifty. Show all posts

Sunday, January 23, 2011

Follow-up - Nifty Trading Strategy - Short Strangle

Thought I'd do a quick follow-up on the Nifty Trading Strategy given a few days back in my post. But before that, I got quite a few queries asking me to explain the strategy a little better, mostly by those who only part understood it and were fairly keen on executing it.

So here's a quick primer on a "Short Strangle Strategy":

Its made by shorting a put option and a call option. The put option must be of a lower strike than the call option. The idea here is, if the underlying (here, Nifty) is likely to stay within a particular range before the next option expiry, you can make money by betting on it. If it does so, good...you get to keep all the premium received by selling a call and a put. If it does not, well, the losses, theoretically, are unlimited. Let's understand this a little better; here's the profit profile of a short call and a short put option.


(click for a sharper image)

So, like it was suggested in the strategy, shorting 1 Nifty (6100 strike) call option on that day would have paid you 
Rs. 15.4 *50 (each lot of nifty has 50 units) = Rs. 770.
Thus, you'll retain this entire amount if Nifty stays below 6100, and you'd break-even at 6115.4 and for every point above 6115.4, you'd stand to lose 1*50 = Rs. 50

And shorting 1 Nifty (5700 strike) put option would have yielded 
Rs. 87 *50 = Rs. 4350.

Thus, you'll retain this entire amount if Nifty stays above 5700, and you'd break-even at 5613 and for every point below 5613, you'd stand to lose 1*50 = Rs. 50

So the total money received by you at the start of strategy would have been 
770+4350 = Rs. 5120.
You'll retain this entire amount if Nifty stays between 5700 and 6100, and you'd break-even at 5613 and 6115.4 for every point below 5613 or above 6115.4, you'd stand to lose 1*50 = Rs. 50

So this is how the profit profile of the suggested short strangle would look like:
(click for a sharper image)
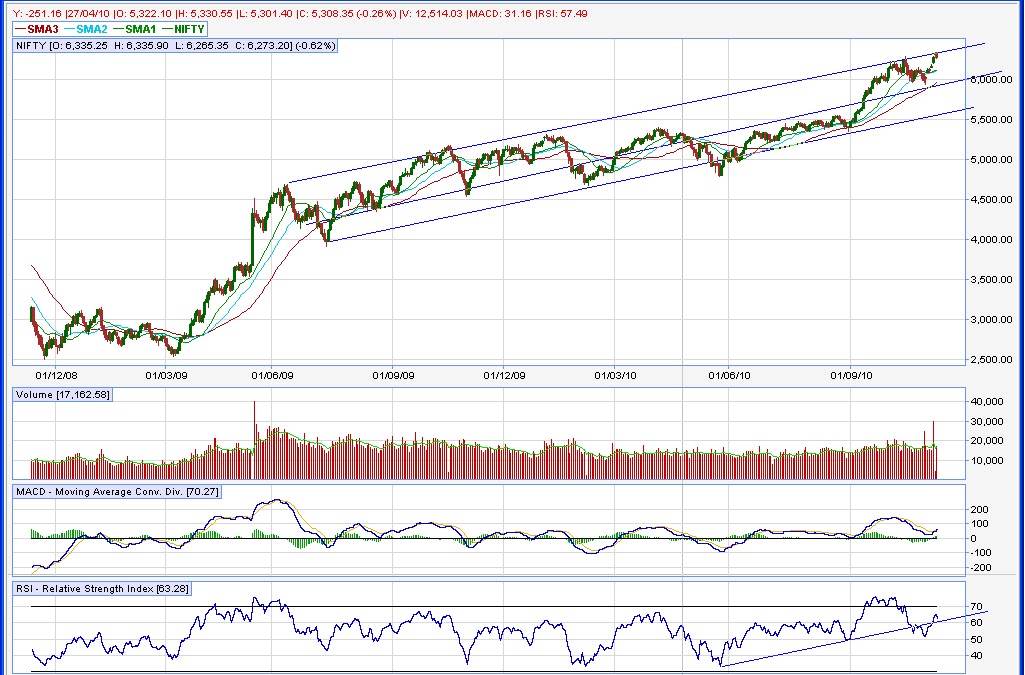
And here's how the strategy has performed from the time it was given:

(click for a sharper image)

As of now, the strategy is making money to the tune of over Rs. 2800 / lot. There are 3 more trading days left - since 26th is a trading holiday. The options will start losing their time value fairly quickly now which will make this strategy more profitable. Any sharp downside movement (we're quite far away from hitting the upper limit of 6100) although, will result in losses. 

Happy Trading !

Wednesday, January 19, 2011

Goldman Sachs on BRICs v/s US Markets

An interesting article in the Telegraph on Goldman shunning BRIC (Brazil, Russia, India and China) nations for US markets for better returns this year. Just thought I'll evaluate this news literally...and here's what I've managed to come up with, please take a look at the following charts of global indices and how they've moved over the last 6 months:

(Click for a sharper image)

Notice among all the markets in the world, namely, US, France, Korea, Canada, UK, Australia, Brazil, India and China, only the latter 2 are actually in a downtrend right now, the rest are actually at or well above their support levels.

The reasons are fairly well publicized, Inflation and an economic hard landing for China and Inflation and fiscal deficit for India. Inflation is the common major worry in both the economies though. China is rumored (conservatively speaking) to suppress its actual inflation figures which some believe to be in early double digits...and for countering a growing distress among local lower-middle class population, it has raised salaries for government employees twice in the last 1 year...and that too by over 20% each time! This is in turn putting an upward pressure on the salaries of their peers in private organizations in China, thereby hurting their wafer thin margins.

India is a worse story in Inflation, recent ads in newspapers and TVs are from poultry chains showing the marginal price difference between vegetable and poultry products...and asking people to make a better choice ! Some people are reportedly even switching to fruit diet as they are almost as costly as vegetables here. Although unlike China, the liquidity is quite tight here, asset bubbles not as great and the banking industry much more robust, but with the government racing down to find the depth of moral bankruptcy through various scams over the last 1 year, its an overall fairly uncertain scenario, which is something no investor will like.

It'll be interesting to see how things unravel from here...will China really crash? Will India see a major correction from here? Will the US economy rebound? Will EU stabilize thus sending gold southwards?

But then again, always keep in mind the (potential) vested interests of such investors, and that there have been times when they have given an outlook for $200 / barrel of crude oil (when oil was $122). Crude eventually went to $147 and then turned back to touch $35 in less than a year. These are interesting times indeed.

Tuesday, January 11, 2011

Indian Markets - down but not out, Trading Strategy

Its amazing to see a strong unidirectional trend in the markets...this time its down ! Consider this, from the start of this year, Nifty has gone down by nearly 7% while some others like Bank Nifty and CNX Realty have shed over 10% and 12% respectively !

Here's the chart for Nifty:
(click for a sharper image)
And for Bank Nifty:

(click for a sharper image)

The reasons for such drastic fall are apparently the flight of hot-money from India in the backdrop of strong consumption / demand and reduced unemployment numbers being reported from US and rising default risks in EU region again reminding investors further about the relative sustainability of the US.

The flight of money from India is also reflected in the USD INR Chart of the last 5 days (see chart below). Notice how INR has moved from 44.4 to nearly 45.4 in just 5 days...in currency markets, that's a HUGE movement.

(click for a sharper image)

China's inflation worries and its continuing stress on further rate hikes is keeping the entire Asia Pacific region on tenterhooks for an impending crash. Besides, China has been coming under increasingly higher pressure to let its currency appreciate in order to help US and Europe cope with their crisis better, which if it happens, would be disastrous for most markets as it will lead to China crashing.

However, I think given the strong 200DMA supports coming up for both Nifty and Bank Nifty, the fall should take a breather here. Moreover, with China reporting a trade surplus (net of Exports - Imports) of nearly USD 13 bn for Dec 2010, (which happens to be much lower than what it was last year in the same quarter), it is in a better position to bargain for slower / no increases in yuan (CNY) during meeting with Barack Obama on Jan 19 this year. [Keeping its currency weak will help China in boosting its export value, and thereby increasing its trade surplus. Ditto for US, which is going to be one of the points of discussion during the meet] Such a bargain (though US is unlikely to give it) will help China immensely in keeping itself from a crash, which will be a good boost to Asian markets.

Besides, with US pumping in more money into the system through its currently on QE II, China is going to find it tough to increase interest rates. This is because if it does, it'll boost what is known as the "Yuan carry trade". The term Carry trade was earlier associated with Yen, wherein, given the near zero interest rates in Japan, investors used to borrow in Yen and invest in foreign markets where interest rates were higher, thereby making a neat sum in this simple arbitrage. For China however, increasing interest rates will bring in even more from the US where the rates are currently near zero. This will further pump up the money supply in China boosting inflation further - which is the last thing China wants at this stage. This will, among other factors, keep China from increasing the rates too much, too often...and it is more likely to contain inflation by sucking liquidity out of the financial system (by increasing reserve ratio for banks, making loans to real estate more difficult, etc.).

Given this scenario, I'd suggest another trading strategy for this month...to sell a Strangle. Sell Nifty Jan 5700 put for 87 and sell Nifty Jan 6100 call for 15.4. This will result in a net inflow of (87+15.4) = 102.4 * 50 units = 5120. If Nifty ends up between 6100 and 5700, before 27th of Jan (another 12 trading days) the entire money is yours.  The break-even points would be 5598 and 6202. Beyond these points, you'll end up losing 50 bucks for every point. Keep your stop-losses in place and trade.

See my earlier trading strategy and its follow-up here.

Disclaimer: No positions as of now. But be aware of the risks...I'm not a trader by profession and don't claim to have any expertise in either trading or recommending trading strategies.

Monday, December 27, 2010

Follow up - Developments on earlier posts

Thought I'd do a quick follow-up on the various posts posted earlier to gauge if the analysis and thought process was at least in the right direction...and also to make note of further developments on some of the topics covered. This post also introduces a video on this blog and a really interesting document, via embedded "Scribd". We'll also take a look at some other improvements that I've made to this blog. Hope you'll enjoy this read...

Saturday, December 11, 2010

Some Questions for 2011

Fidelity has released a list of questions, pretty interesting ones...(HT: Pragmatic Capitalism) so I thought I'll try and answer some of those...and raise some of mine as well. In this post, I'm only going to pose the questions...I'll need time to compile these answers, which I'll post as a follow up post just before the New Year...and compare notes with the markets by the end of next year.

These are really interesting questions...and like someone said, a lot of times its the Question that's more important than the answer...! Take a look at the questions, all related to markets, global economy, etc. and think about them...If you would like, let me know what you think about some of these questions....
============================================================
  • Is Euro zone going to fall apart? Will Euro cease to exist as a currency?
  • Which countries in Euro-zone are getting into trouble next? Will anyone default?
  • How will the currency war be played out between US and China?
  • Will the US Economy recover?
  • Are Gold and Silver the new proxies for currencies? Will countries start dealing in Gold and shun dollar completely?
  • Will the bull run in commodities continue?
  • Will emerging markets (EM) remain the driver of global growth, even though China and other countries are counteracting the Fed’s monetary policy?
  • Will Inflation in EMs come down?...And finally,
  • What is the outlook for INR-USD and Nifty?
============================================================
    Now, each of these could be a research topic, but I'll try to answer as many as I can before new year...and also try and keep it simple...Please let me know if you'd like me to include something else in this list.

    Sunday, December 05, 2010

    Follow-up - Nifty Trading Strategy

    Nifty Trading Strategy, as posted on this blog on 25th of Nov, recommended selling a 5700 December Put option @ 95. Assuming you managed to sell it lower @ 90, the returns for 1 lot for 1 week weren't too bad...close to Rs. 3200...considering the current price is around 24. 
    Here is a chart depicting how the price of that option and profit or loss on this strategy moved between that day and today...

    (click for larger image)

    The profits should still go further from here (meaning, this value of 24 should eventually - by 30th Dec - that's when this option expires, should go down to 0), giving a further upside of 24*50 = 1200 (50 is the lot size of Nifty options, so if nifty option prices move by Rs. 1, you stand to gain or lose Rs. 50 from that move).

    The point I was trying to make in my earlier post was, selling index options although risky (theoretically, if Nifty went to zero, the above position would have resulted in a loss of 5700 * 50 = Rs. 2,85,000, while the max the above position can earn under any circumstance is 90 * 50 = 4500), but if taken with a view on Nifty, and played even conservatively, can yield decent profits with a fairly high probability of success. From here, even if nifty were to move down from current 6000 levels, to nearly 5700 points over the next 20 days, you'll still end up keeping the entire 90 bucks that you got by selling the option.

    That said, selling options is not an easy game to play, the risks are huge and profits small...but it holds a far better profit potential than buying an option. But do understand the game first before you sit down to play it...

    Thursday, November 25, 2010

    Nifty, Markets, Trading Strategy

    LIC Housing Finance Scam really knocked the steam out of the markets which were showing all signs of reversing a trend yesterday. However, I think it should be better today, Banks though still have some more downside left. But overall, Nifty should move up from here, as it has a strong support coming up at 5850 levels, with another decent support coming up at 5750.

    A quick look at the same chart that I've posted in my earlier posts here and here:


    Overall markets will continue to remain cautious, with Ireland bankruptcy possibility still lurking around the corner and new issues like the N/S Korea war creating further jitters. But overall, I don't think in the times of geopolitical distortions, currency wars, protectionism, etc, a military war-game is required...there are better and more advanced tools available now to kill an economy ! So expect markets to gradually tide over these news, and focus on the regulations, policies, dictats...for these will be driving the world for some time to come.

    Just a quick word on the trading strategy for Nifty, i think selling a Dec 5700 put (currently at 95) should work out in this scenario as Nifty looks unlikely to breach 5700, in which case time decay will take the value out of this instrument. Aggressive traders can even look at selling 5800 puts.

    (Disclaimer: Please do your own research before taking any positions. I am not a trader / investment advisor and may have vested interests in recommendations).

    Friday, November 19, 2010

    Indian Markets, Nifty - What Next?

    Questions are again popping up from various pockets as to how much more downside is left in the market...I think the market will correct a little more from here, maybe about another 100 - 150 points on Nifty (till 5850, currently at ~ 6000). There is even a (small) possibility of a fall towards 5700.

    Here's a quick look at the Nifty Chart: (notice how the DMI is not supporting the fall much).


    Bank Nifty too looks like it might fall some more...and SBI (one of the highest weights in Bank Nifty) also looks set to correct some more...However, these falls (including Nifty's) should last less than a week after which markets should again look up.

    Tuesday, November 16, 2010

    BSE launches Realised Volatility Index

    BSE has launched India's first Realised Volatility Index today in a bid to increase its (abysmal) equity derivatives volumes. You can download the PDF to view more about this here. BSE will lauch 1, 2 and 3 month futures and options contracts to trade in this RealVol Index.

    First, let's understand what this is and how it can be used, followed by goof-ups:

    What is Realized Volatility? How does it compare with VIX, which is already launched?
    Realized Volatility is calculated from actual volatility of BSE Sensex. In contrast, Voltility Index (VIX), which is a measure of implied volatility in the market (as the market views it - it may incorporate the "fear factor" in the market, or swerve drastically with spikes / drops in call-money rates, which are referenced as borrowing rates for short term (1-2 days)). So unlike VIX, if market is very volatile, but closes near its previous close, the RealVol will either not be affected much or it'll go down to a certain extent.

    How do Realized Volatility Futures / options help?
    Realized Volatility provides traders with a tool to hedge their option values against volatility movements. As some of you might be knowing already, an Option price varies primarily with 3 parameters - Price of underlying, Volatility, and Time to expiry. So let's say if you've bought a Call option on Nifty (can't imagine anyone buying an option on Sensex due to poor liquidity), you should make profits if Nifty moves up. BUT, if the volatility of Nifty drops, or its taking too long to move up, (which it does finally), your option will still end up losing its value. So, higher volatilities / time add to option values and vice-versa.
    Thus, for options traders, even if their view goes right, but volatility drops, they still end-up making losses. To avoid this, they can sell volatility futures / call option / buy put option and thus hedge their long call option position against volatility.

    Goof-ups:
    This idea is probably borrowed from CBOE, which is ok...but there are major issues in implementation. To understand this, first lets have a quick look at the comparison of similar products from BSE and CBOE.


    (click on the image for a larger view)

    • BSE is taking the average standard deviation formula into account, without doing (n-1) in the denominator ! Statistically speaking, you should average with 'n' if and only if, you are taking the entire data set (or population) into consideration for calculation. But if you are taking only a sample data from the bigger data set, you should take 'n-1' to account for degrees of freedom. This is an unacceptable error ! [Besides, taking average standard deviation is not a very good measure, its always better to use conditional volatility (EWMA, GARCH, etc.) for better accuracy...but more on this sometime later].
    • A little digging reveals the reason why they are doing so...this is because they are resetting the value of n after every interval. It means that for calculating 1-month RealVol, lets say today is the first day of RealVol futures / options contract, they will take only 1 day volatility into account. On the 2nd day, they take the average of the last 2 days (including today's EOD Sensex value), on the 3rd day, average of last 3 days, and so on...till the 22nd day (last trading day, unlike calendar days which will be 30 at this stage), when they'll take average of last 22 days. And then bang ! Again the next 1 month starts with 1 day average !!! See example below to understand this better. 


      In this example, I've calculated 1 month RealVol (annualized) based on CBOE method and BSE method...and see the difference on the first couple of days...What this means is, if  day1 (second last row) is, say extremely volatile, (lets say Sensex tanked by 5%), then the first day RealVol value will be high, then if sensex closes at the same level next day, the RealVol will be nearly half of yesterday's value...! Such a drastic drop (30%) in value of RealVol in just 1 day, whereas if you actually see using the correct methodology (CBOE's), its not so drastic. People long on volatility futures / options on day 2 will most likely get stopped out...despite the fact that volatility did not really fall by that much...! CBOE, on the other hand, calculates RealVol on 22-day rolling window basis (for 1 month series), and so does not see large fluctuations at the beginning of the series.
      BSE's method of NOT taking rolling window is also the reason (perhaps) behind ignoring degrees of freedom (not taking 'n-1') in the denominator, as otherwise, on the first day the real vol figure will be undefined !
    I hope you've got the picture...the intention is good, but as usual, the execution is poor. Even in nifty options, the volume are extremely poor for the 2nd and 3rd month series, so for BSE (with really poor liquidity in derivatives overall) RealVol series of 2nd and 3rd months most definitely will not be traded in near future. It just the 1st month which will see some action...but as soon as market realizes that the RealVol is not actually helping them in hedging their options, they'll forsake this instrument...and then BSE guys will wonder why the heck is their derivatives section not taking off...[By the way, futures and options are not fungible across exchanges, so if you buy Nifty options, and hedge using RealVol option on Sensex, though there is good correlation, its not a very good hedge anyways]

    I hope someone in BSE is taking a note of this...and also in NSE...so that they'll not make the same mistake. Expect something similar from NSE soon.

    Friday, November 12, 2010

    Follow-up - Currency regulations, markets

    A quick follow-up to some of my earlier blog posts:

    Earlier I wrote about impending regulations due to currency crisisit might be worth noting the slew of opposite opinions coming in from PM's Economic Advisory Council (here), which categorically denies the need to have any new / additional regulations to be put in place to stop the flow of free money coming from US into India. Another one supporting that argument, Stephen King (from HSBC) says, India may not need to have such regulatory measures to be put in place...and the same can be done by tightening lending to real estate and other such measures.

    Going by the recent minor depreciation in INR vs USD, looks like the markets support this view...but I'd still keep an eye open for this, for this'll affect the markets in a far bigger way that any other single fundamental factor. Besides, with RBI giving optimistic estimates of inflation coming down by December, markets might just be in a wait-and-watch mode...'coz if the inflation doesn't come down as expected / projected...RBI might put in some regulatory measures to prevent the flow of cash from US. But overall, for now, this news is a kick on my back - side !

    In another post, I wrote about the markets not looking too good for another rally immediately. From that time, Nifty has moved down from 6300 levels to a little under 6100 at the time of writing this review. 200 points on nifty - not bad ! (pat on my back).

    Tuesday, November 09, 2010

    Musings - I

    So, Gold is finally trading over $ 1408 (/ ounce)...guess QE-II is starting to take its effect already !!! (atleast on market psychology). Just in case you want some other views on this...you can find some more reading stuff of here...and several such blogs.

    But, its once in a while that such news reports emerge...highlighted by one of the most read and respected blogs on global economy...Mish (on my reading list). Its reports like these that are hard to ignore.

    Also, for traders in Indian stock markets, Nifty looks set for a minor correction (i could go wrong here) but just a minor one as there are good number of supports within 10-15% range. Post that, it looks set for another rally...I'm inclined to take a contrarian approach here - almost whoever i still speak to (on markets) is of the opinion that markets have run-up quite a bit and should see a major correction from here on...desist from fresh investments, etc. Its exactly this thinking that's going to keep people nimble and cautious...not a very good recipe for a crash !

    A quick chart for those interested: