Showing posts with label trading strategy. Show all posts

Sunday, January 23, 2011

Follow-up - Nifty Trading Strategy - Short Strangle

Thought I'd do a quick follow-up on the Nifty Trading Strategy given a few days back in my post. But before that, I got quite a few queries asking me to explain the strategy a little better, mostly by those who only part understood it and were fairly keen on executing it.

So here's a quick primer on a "Short Strangle Strategy":

Its made by shorting a put option and a call option. The put option must be of a lower strike than the call option. The idea here is, if the underlying (here, Nifty) is likely to stay within a particular range before the next option expiry, you can make money by betting on it. If it does so, good...you get to keep all the premium received by selling a call and a put. If it does not, well, the losses, theoretically, are unlimited. Let's understand this a little better; here's the profit profile of a short call and a short put option.


(click for a sharper image)

So, like it was suggested in the strategy, shorting 1 Nifty (6100 strike) call option on that day would have paid you 
Rs. 15.4 *50 (each lot of nifty has 50 units) = Rs. 770.
Thus, you'll retain this entire amount if Nifty stays below 6100, and you'd break-even at 6115.4 and for every point above 6115.4, you'd stand to lose 1*50 = Rs. 50

And shorting 1 Nifty (5700 strike) put option would have yielded 
Rs. 87 *50 = Rs. 4350.

Thus, you'll retain this entire amount if Nifty stays above 5700, and you'd break-even at 5613 and for every point below 5613, you'd stand to lose 1*50 = Rs. 50

So the total money received by you at the start of strategy would have been 
770+4350 = Rs. 5120.
You'll retain this entire amount if Nifty stays between 5700 and 6100, and you'd break-even at 5613 and 6115.4 for every point below 5613 or above 6115.4, you'd stand to lose 1*50 = Rs. 50

So this is how the profit profile of the suggested short strangle would look like:
(click for a sharper image)
And here's how the strategy has performed from the time it was given:

(click for a sharper image)

As of now, the strategy is making money to the tune of over Rs. 2800 / lot. There are 3 more trading days left - since 26th is a trading holiday. The options will start losing their time value fairly quickly now which will make this strategy more profitable. Any sharp downside movement (we're quite far away from hitting the upper limit of 6100) although, will result in losses. 

Happy Trading !

Tuesday, January 11, 2011

Indian Markets - down but not out, Trading Strategy

Its amazing to see a strong unidirectional trend in the markets...this time its down ! Consider this, from the start of this year, Nifty has gone down by nearly 7% while some others like Bank Nifty and CNX Realty have shed over 10% and 12% respectively !

Here's the chart for Nifty:
(click for a sharper image)
And for Bank Nifty:

(click for a sharper image)

The reasons for such drastic fall are apparently the flight of hot-money from India in the backdrop of strong consumption / demand and reduced unemployment numbers being reported from US and rising default risks in EU region again reminding investors further about the relative sustainability of the US.

The flight of money from India is also reflected in the USD INR Chart of the last 5 days (see chart below). Notice how INR has moved from 44.4 to nearly 45.4 in just 5 days...in currency markets, that's a HUGE movement.

(click for a sharper image)

China's inflation worries and its continuing stress on further rate hikes is keeping the entire Asia Pacific region on tenterhooks for an impending crash. Besides, China has been coming under increasingly higher pressure to let its currency appreciate in order to help US and Europe cope with their crisis better, which if it happens, would be disastrous for most markets as it will lead to China crashing.

However, I think given the strong 200DMA supports coming up for both Nifty and Bank Nifty, the fall should take a breather here. Moreover, with China reporting a trade surplus (net of Exports - Imports) of nearly USD 13 bn for Dec 2010, (which happens to be much lower than what it was last year in the same quarter), it is in a better position to bargain for slower / no increases in yuan (CNY) during meeting with Barack Obama on Jan 19 this year. [Keeping its currency weak will help China in boosting its export value, and thereby increasing its trade surplus. Ditto for US, which is going to be one of the points of discussion during the meet] Such a bargain (though US is unlikely to give it) will help China immensely in keeping itself from a crash, which will be a good boost to Asian markets.

Besides, with US pumping in more money into the system through its currently on QE II, China is going to find it tough to increase interest rates. This is because if it does, it'll boost what is known as the "Yuan carry trade". The term Carry trade was earlier associated with Yen, wherein, given the near zero interest rates in Japan, investors used to borrow in Yen and invest in foreign markets where interest rates were higher, thereby making a neat sum in this simple arbitrage. For China however, increasing interest rates will bring in even more from the US where the rates are currently near zero. This will further pump up the money supply in China boosting inflation further - which is the last thing China wants at this stage. This will, among other factors, keep China from increasing the rates too much, too often...and it is more likely to contain inflation by sucking liquidity out of the financial system (by increasing reserve ratio for banks, making loans to real estate more difficult, etc.).

Given this scenario, I'd suggest another trading strategy for this month...to sell a Strangle. Sell Nifty Jan 5700 put for 87 and sell Nifty Jan 6100 call for 15.4. This will result in a net inflow of (87+15.4) = 102.4 * 50 units = 5120. If Nifty ends up between 6100 and 5700, before 27th of Jan (another 12 trading days) the entire money is yours.  The break-even points would be 5598 and 6202. Beyond these points, you'll end up losing 50 bucks for every point. Keep your stop-losses in place and trade.

See my earlier trading strategy and its follow-up here.

Disclaimer: No positions as of now. But be aware of the risks...I'm not a trader by profession and don't claim to have any expertise in either trading or recommending trading strategies.

Thursday, December 09, 2010

Trading Strategies

Have you ever felt that you're too small (or retail) to make big money in the markets, and the big guys take all the profits...or that you wish someone would give you a magic wand which will show you a glimpse of today's market's closing prices at the beginning of the day...or that you're trying your best to trade but somehow the stock moves up only after after you've sold it? Well, i won't give you my magic wand (:)), but can tell you about how I deal with these nagging queries.

This post is about various Trading Strategies that are used by retail people, people like  you and me. I've tried to cover as many as I can think of / have used at sometime or the other...please let me know if there are any I've missed and I'll add them as an addendum to this post. I'm sure among those of you who trade, (not necessarily for a living) you've also used some of these, but the point here is in figuring out if a little improvisation is possible. Note that some of these forms could be quite India specific (like IPO Trading), but the rest are fairly general and are applicable to almost all markets.
  • Tip-based Trading:
This is the most popular form (and arguably the least rewarding) of trading - the only variation here in different cases is the source of the tip. The sources can vary from friends, acquaintances and brokers / broker reports to Electronics and Print media. Now, this form of trading is really tempting, with no underlying rules / analysis from our side...someone tells us what to buy / sell and we do it...hoping that that person has done enough research. 

But more often than not, these tips are released at the fag end of the move...so your risk - return ratio is not very tempting (buy something for 200 bucks, stop-loss 190, target 210 for 3 - 5 days, gives us a risk-reward ratio of nearly 1 (5% / 5%), which is not very tempting). The reason risk-reward ratio should be taken into account in every trade is because no one can make money on all the trades...so lets say, out of 10 trades, you went right 5 times and wrong 5 times. Assuming you had a risk-reward ratio of 1 every time, and you managed to keep your stop losses and target strictly in place...you'd have made 0 bucks !


Thus, with such forms of trading, the reduced effort on analysis needs to be compensated with far higher efforts on trade management. You need to always be on top of your positions. Some people use these tips to identify stocks with interest of large operators. The operators are a reality of the market...they pump in / take out huge money in small / mid / large cap stocks and cause significant movements therein. These tips only tell us, which stocks operators are / were interested in...


Just as a parting note - if you do trading based on this style, have you ever measured how much your returns have been on an overall basis (year till date) / how much the stock has moved in anticipated direction before and after the tip? If not, I recommend that you do this analysis, I'll definitely open your eyes to some new insights !
  • Twitter based Trading
Ideally, I'd have liked to include this as well in the above section, but since its a relatively newer form of receiving tips, I decided to have a separate section on this. Twitter is a good source of getting accumulated tips from various sources, all at one place...(I think this is the best use of twitter, don't really know what else people would want to use Twitter for ;)). And you receive tips at the speed of light. Just follow various broking houses / independent analysts / brokers / print media tweets, etc. and you'll remain on top of tipping world !

But again, just like above, use this with your own discretion. Use these tips to identify stocks which are on the move, analyze those (its not too difficult)...and take a call on a case-to-case basis. Overall, this form of trading reminds me of a quote from someone during 2008 crisis - "Its amazing how world keeps finding new ways of losing money when the old ways seemed to be working just fine...". I'll always remember this quote ;)

  • IPO Trading
This is generally regarded as a risk-free trading strategy. Apply in IPO, it opens up anywhere between 20 -200%, sell and get out of the stock...Instances of IPO opening below IPO price is far lower than otherwise, so it is a good strategy that yields decent to excellent returns. But here as well, some research on the company (whether to apply or not) and money management (how much to apply, also, which ones if multiple IPOs are open) will definitely help. One not so difficult way of doing this (atleast in India, not so sure about other markets), is to see the premium being quoted in the grey market.

The grey market starts predicting the gains per application (each application of 100k / 200k) well before the IPO closes. These rates are available on various websites...and are a decent indicator of how the IPO is going to perform.

  • News based Trading
This form involves tracking news (publicy disclosed, potentially having large effect) and trading based on that. For example, if interest rates are increased, the markets usually will not like this as it is a sign of Central Bank cooling off the growth, or if industry specific / stock specific news is released, people will quickly take a stance on that and trade accordingly.

The essence here is that of both analysis and time...you need to understand firstly, whether the news is good / bad for a particular stock / industry / market. Secondly, how large could the potential impact be (a company instead of posting 15% top-line growth in a quarter, posted 17% growth - its positive, but the news will get incorporated in the stock as soon as it is released). And thirdly, you need to implement the conclusions from the above two points quickly....'coz as soon as the news is released, market players with ready access to trading terminals, (and of course, quick fingers) will take the lead in entering trades. But large impact news is usually analyzed thoroghly in trading rooms End-of-day for large trading houses...and they adjust their positions over the next few days...So you still have time to move and run with the majority of the profit leg.

I've known a few people who trade on this form (among others). I'd say, if you have a macro & micro perspective, there is no dearth of data coming in everyday...from inflation figures, to unemployment, to bond market movements, budget sessions, quarterly results, housing data, confidence level in businesses...all you need is a keen eye, an understanding of the potential intensity and direction of movement, and of course, quick fingers...!
  • Analysis (Technical / Fundamental) based Trading
This form of trading has seen most amount of ink flow under it. So many, so many readings are available on this, that I dont think i can ever do justice to this form by getting into the details. One of my personal favorites on Fundamental Analysis is "One Up on Wall Street" by Peter Lynch. Simple and applicable....just the kind I prefer. Technical analysis is also fairly widely available on the internet, including free e-books and numerous articles.
Which approach you'd like, is something you'll have to figure out on your own...I've moved between both fundamental and technical to a point where I look at both now...and weightage given to these techniques differs based on how long I'd like to hold the stock....(fundamentals for really long term, technicals for really short term). If you're going to start with technical analysis, I'd suggest that you take a subscription of an online technical analysis tool which has data for your market...generally such subscriptions are not very costly ...(approx your monthly phone bill) but will enable you to implement your understanding well.

  • Strategy based Trading
Now, this is where quants come in and retail sits back. Apart from a few guys here and there, I've not seen too many people dealing with this form of Trading. In strategy based trading, you need to have some kind of strategy - it could be an arbitrage strategy, or stats based strategy, or based on some kind of algo which tracks fundamentals & technicals both and suggests the best buys / sells...or anyhting else. This form is not so well written, and is also kept close-to-their-hearts by whoever has devised the strategy.

One of the popular strategies is called Pair Trading...in this strategy, the price ratio of a pair (logical one - like MS and Oracle OR Citibank and BankAM) is tracked. Under normal circumstances, it would move within a fairly narrow range, but if the ratio goes 2 or 3 standard deviations above or below normal, you can take a long position in one and short position in another. E.g. If Oracle / MSFT ratio is 1.075, and if it goes suddenly to say, 1.11...you can see if this kind of volatility is normal or not, and if not, you can sell Oracle futures and buy MSFT futures at prices such that the ratio is 1.11 or higher. 

The assumption here is that in a few days, the ratio will come down to 1.07 levels or lower. For this to happen, there are multiple ways...either Oracle has to move down, or MSFT has to move up, or a bit of both. Alternatively, oracle stock price rises, but MSFT rises even more...OR Oracle falls, but MSFT falls lesser...in either case...you'll make money on at least one leg even after deducting losses made on the other.


Notice the beauty of this strategy, its market neutral - you don't care too much about which direction the market or these stocks move...all that you care about is one moves lesser than the other. In the Indian markets as well, there are several such pairs possible - Infy-Wipro, HDFC Bank - ICICI Bank, ACC-Gujarat Ambuja, TCS-Infy, Axis Bank - HDFC Bank....and so on. Now, its not that there is no risk here, the ratio may not come back to its normal levels before the futures expire, in which case you'll book a loss...but studied well and executed well, this strategy can potentially beat many other strategies hands-down - primarily because the risk involved in this is lesser.


There are other forms of Strategies as well, like Moving Average (MA) strategy, wherein - you buy whenever a stock's 20 day MA cuts 50 day MA on the upside and sell when its the reverse. There are multiple choices available here as well, 5-20, 10-30, etc. There are chances of a whip-saw, wherein, the 20 DMA cuts 50 DMA on the upside, you take a long position, and then soon after the stock goes down and 20 DMA cuts 50 DMA again but on the downside making you reverse your position. But overall its fairly simple and mostly effective strategy to follow...take a look at the opportunities available in Nifty over the last couple of years based on only this strategy. It can work wonders in trending markets. In the chart below, I've used 30-50 combination...check it out.


(Click for a larger image)


There are some other strategies as well, like Algorithmic trading, Basket trading etc...but those are advanced ones...may be in some other post...!


Please do let me know if you too use one of these / any other...I'll probably compile a list of those as well and make another post on that...

Sunday, December 05, 2010

Follow-up - Nifty Trading Strategy

Nifty Trading Strategy, as posted on this blog on 25th of Nov, recommended selling a 5700 December Put option @ 95. Assuming you managed to sell it lower @ 90, the returns for 1 lot for 1 week weren't too bad...close to Rs. 3200...considering the current price is around 24. 
Here is a chart depicting how the price of that option and profit or loss on this strategy moved between that day and today...

(click for larger image)

The profits should still go further from here (meaning, this value of 24 should eventually - by 30th Dec - that's when this option expires, should go down to 0), giving a further upside of 24*50 = 1200 (50 is the lot size of Nifty options, so if nifty option prices move by Rs. 1, you stand to gain or lose Rs. 50 from that move).

The point I was trying to make in my earlier post was, selling index options although risky (theoretically, if Nifty went to zero, the above position would have resulted in a loss of 5700 * 50 = Rs. 2,85,000, while the max the above position can earn under any circumstance is 90 * 50 = 4500), but if taken with a view on Nifty, and played even conservatively, can yield decent profits with a fairly high probability of success. From here, even if nifty were to move down from current 6000 levels, to nearly 5700 points over the next 20 days, you'll still end up keeping the entire 90 bucks that you got by selling the option.

That said, selling options is not an easy game to play, the risks are huge and profits small...but it holds a far better profit potential than buying an option. But do understand the game first before you sit down to play it...

Thursday, November 25, 2010

Nifty, Markets, Trading Strategy

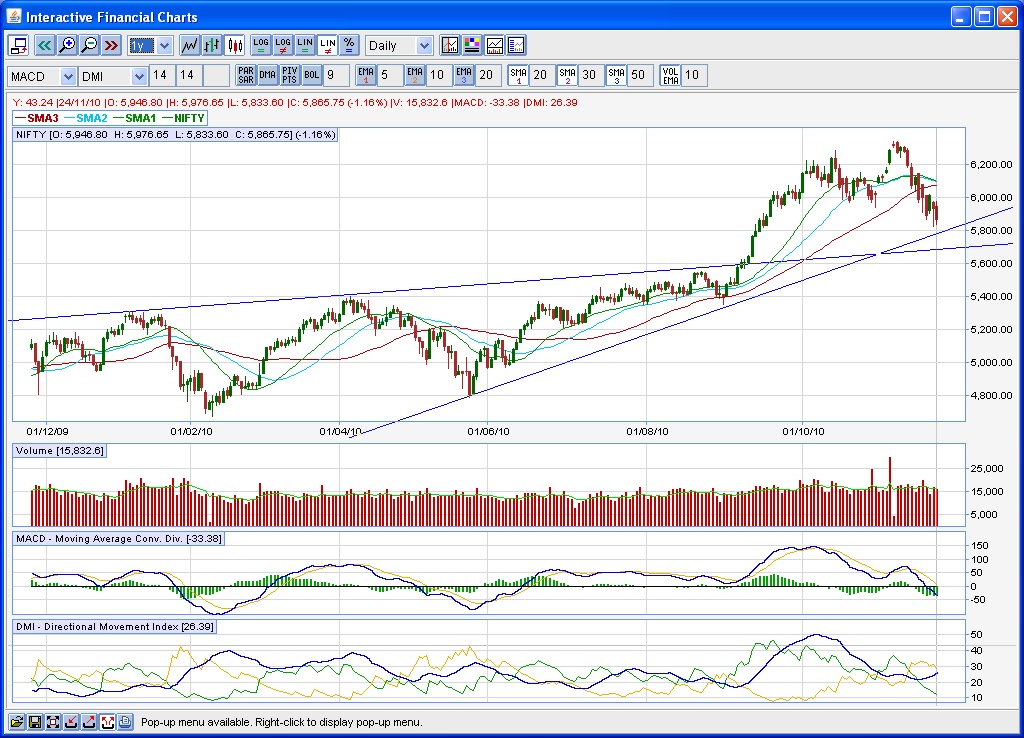
LIC Housing Finance Scam really knocked the steam out of the markets which were showing all signs of reversing a trend yesterday. However, I think it should be better today, Banks though still have some more downside left. But overall, Nifty should move up from here, as it has a strong support coming up at 5850 levels, with another decent support coming up at 5750.

A quick look at the same chart that I've posted in my earlier posts here and here:


Overall markets will continue to remain cautious, with Ireland bankruptcy possibility still lurking around the corner and new issues like the N/S Korea war creating further jitters. But overall, I don't think in the times of geopolitical distortions, currency wars, protectionism, etc, a military war-game is required...there are better and more advanced tools available now to kill an economy ! So expect markets to gradually tide over these news, and focus on the regulations, policies, dictats...for these will be driving the world for some time to come.

Just a quick word on the trading strategy for Nifty, i think selling a Dec 5700 put (currently at 95) should work out in this scenario as Nifty looks unlikely to breach 5700, in which case time decay will take the value out of this instrument. Aggressive traders can even look at selling 5800 puts.

(Disclaimer: Please do your own research before taking any positions. I am not a trader / investment advisor and may have vested interests in recommendations).